LLM Observability: What AI Labs Watch

Cicero Campelo, CISSP
August 25, 2026 · 16 min read
Part of our guide to AI for startups.
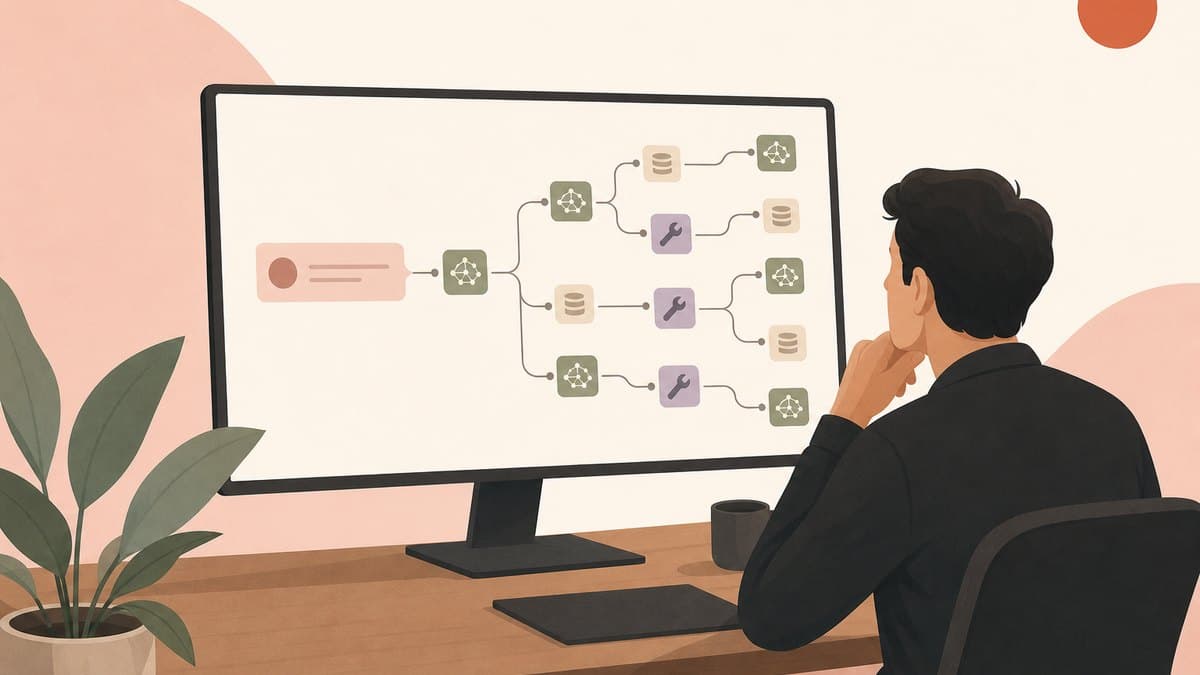
Table of contents
- What LLM observability actually is
- You are where operations teams were before observability had a name
- What the AI labs watch, and why copying them is a trap
- What to capture in an LLM trace
- Instrument for the agent that will read the traces
- What LLM observability tools do, and when you need one
- Your trace store is now your most sensitive database
- What to do this week
- Sources
- Frequently asked questions
Your service returns a 200. Your latency chart is flat. Nothing pages anyone. And the answer your user got was wrong.
That is the failure ordinary monitoring cannot see, and it is the reason LLM observability exists as a separate job. Search the term and page one is mostly vendors, each one selling a dashboard. The dashboards are real and some of them are good. None of them answer the question a founder is actually asking, which is what you are supposed to watch, and whether any of it matters before you have real customers.
The short answer: LLM observability is the practice of recording what your model actually did in production. The exact prompt and context it received, the documents it retrieved, the tools it called, what it returned, what that cost, and how long it took. It is a separate discipline from ordinary application monitoring because the failure it catches never raises an error, so every alarm you already have stays quiet.
That gap is not a new kind of problem. It is the same gap that created observability in the first place, and one of the people best placed to describe it is Olivier Pomel, co-founder and CEO of Datadog, who sat down for a conversation at Y Combinator's Startup School Paris published in July 2026. Datadog now sells to a customer list that includes, by his account, the labs building the frontier models. What he says about that vantage point is more useful than what most people expect him to say.
What LLM observability actually is
Start with the boundary, because four disciplines get sold under overlapping names and founders keep buying the wrong one.
Evals score model output against a dataset you control, before you ship. You write the cases, you define what good looks like, you get a number. That is the subject of our piece on LLM evaluation, and it is where quality gets defined.
AI testing verifies that the software around the model still works when a user clicks through it, which is the pre-ship gate we cover in AI testing for the AI coding era. It answers whether the product runs, not whether the model was right.
Application debugging reconstructs why your software broke from the telemetry it emitted. Stack traces, error rates, the log stream. We covered that in AI debugging, and it is what you reach for when something threw.
LLM observability is the fourth thing, and it exists because your model layer defeats all three. Nothing throws. There is no dataset, because this is a real user asking a question nobody wrote a test case for. The unit of telemetry is not a log line or an error, it is a trace: one user action, expanded into the full chain of model calls, retrievals, and tool invocations that produced whatever they saw.
The distinction matters commercially, not just conceptually. An eval score tells you your system cleared the bar you set, on the cases you thought to write down. Observability tells you that the customers who quietly stopped using the feature last month all hit the same retrieval path returning nothing, and that a release two weeks earlier had been truncating their context without anyone noticing. One is a grade. The other is a diagnosis.
All four are inputs to a fifth question, which is whether the system still returns something usable when one of its parts fails. That is AI reliability, and it is decided by the fallbacks, timeouts, and degraded modes around the model rather than by anything a trace or an eval measures. Observability is how you find out a failure happened; reliability is what the system did about it.
There is now a public vocabulary for this. The OpenTelemetry project maintains GenAI semantic conventions, a standard set of span names and attributes for model calls, embeddings, retrievals, and tool execution: gen_ai.request.model, gen_ai.usage.input_tokens, gen_ai.usage.output_tokens, gen_ai.tool.name, and so on. Two things to know before you build on it. It is genuinely useful as a checklist of what is worth capturing. And its status, as of this writing, is Development, which in OpenTelemetry's own terms means the schema can still change under you. Instrument against it, but do not treat the attribute names as load-bearing.
You are where operations teams were before observability had a name
Pomel started Datadog in 2010 with his co-founder Alexis Lê-Quôc, now its CTO. Asked whether there were observability companies around when they began, his correction is the whole history in one line: "It was not called observability, it was called monitoring."
What monitoring meant then is worth hearing precisely, because it is a good description of where most AI products sit today. It was, he says, "very job specific and very reactive." You had a product for network monitoring. You had something the ops team used. And then the sentence that should be uncomfortable for anyone shipping an LLM feature right now: "Developers would be blind to anything that happened in production, pretty much."
Swap the nouns. Today you have a model provider's usage dashboard that tells you tokens and spend. You have your normal application monitoring that tells you the endpoint returned. Neither of them can tell you what your product actually said to a customer, or why. The person who wrote the prompt is blind to what it does in production, pretty much.
Pomel's naming story is about selling a product, but the mechanism underneath it explains something else: why this work stays unfixed longer than it should, and why that is a naming problem rather than a technical one. Datadog did not start with the name it ended up with. The first framing was a new category, "a data platform for DevSecOps to collaborate," and they dropped it for the boring, legible one: infrastructure monitoring. "We didn't call it observability," he says, because that word did not exist yet. What the new-category framing had cost them: "people love the idea of a new thing, but they have no idea why they should pay for it and their boss has no idea why they should pay for it."
That is exactly why LLM observability keeps losing the sprint planning argument inside startups. It has no budget line and no obvious owner. It is not a feature, so product does not want it. It is not an outage, so engineering does not schedule it. The founder version of the fix is the same one Datadog used: stop pitching your team a new category and attach the work to a bill somebody already recognizes. Which is usually the support queue.
What the AI labs watch, and why copying them is a trap
The headline version of this section is what the labs watch. The useful version is why you should not copy it.
Pomel says Datadog has "the top 10 AI companies in the world as customers," which gives him a view most people do not have. He describes the frontier labs as customers who "use our product in weird ways because they have infinite compute" and access to "the models that nobody has yet." The obvious follow-up is whether that is a preview of what everyone else will be doing later.
His answer is a qualified yes, and the qualification is the useful part: "it's not necessarily the most representative," because "the rest of the world doesn't have infinite compute." So, he says, "they might do things in a way that the rest of the world is not going to do."
Sit with that, because it inverts the usual content about what top AI labs do in production. The practices those labs can afford assume an inference budget nobody else has, and Pomel's own illustration is the cost: most companies, he says, "are not going to be very happy to incinerate a billion in compute to do a lot of internal things in a way that these people can do." Whatever the specific techniques turn out to be, their price scales with your traffic, and they were set by teams for whom compute is not the constraint.
For a startup, the constraint is engineering hours first and inference budget second. A practice that costs a frontier lab nothing costs you a headcount. The transferable insight from the labs is not their technique list. It is the shape of what they instrument: the full input, the full output, and the ability to go back and ask a question of past traffic they had not thought to ask at the time. That last property is what you should copy, because it is cheap to preserve and impossible to recover later.
The same logic runs through Pomel's description of how Datadog now decides what to build. With AI, he says, "things are changing so fast that you just can't wait to see the demand materialize from the customer base." He is honest about the cost of that posture, which is being wrong more often and having to be at ease with it. His example is that "the way you write code or don't write code has changed three times in the last year." If the practice around your model layer is going to be rewritten three times a year, do not buy a rigid stack. Preserve the raw material and stay cheap to change.
What to capture in an LLM trace
This is the smallest trace that answers a real incident. Founders do not need a maturity model. They need to know the minimum to capture so that next month's angry customer email is answerable. Four things, in priority order.
- The complete input, not the template. Store the fully resolved prompt: system instructions, retrieved documents, conversation history, and the user turn, exactly as the model saw them. The template is in your repository already. The rendered context is the thing you cannot reconstruct, and it is where most quality bugs live, because the retrieval silently returned the wrong three chunks. If you are wondering why long contexts degrade rather than help, our piece on context rot covers the failure mode this data lets you catch.
- The tool calls and their results. For anything agentic, the model's decision to call a tool, the arguments it passed, and what came back. When an agent behaves strangely, the cause is almost always a tool that returned something unexpected and a model that then reasoned confidently from it. Without the arguments, you are guessing.
- Cost and latency joined to a user action, not to an endpoint. Token counts per call are easy and nearly useless on their own. What you want is the total spend and total wall-clock for one thing a customer tried to do, summed across every model call it triggered. This is the number that tells you whether your pricing survives your power users, and it is the number nobody has when the board asks.
- One thin quality signal, attached to the trace. Not an eval suite. A thumbs-down button, a retry, an abandoned session, a support ticket id. Anything that lets you filter to traces where the user was unhappy. A trace store you cannot filter by outcome is an archive. A trace store you can filter by outcome is a work queue.
Notice what is not on the list. No dashboard, no vendor, no scoring model. All four are capture decisions, and all four are worth roughly nothing if you make them after the incident, which is the same lesson production debugging teaches: no system recovers a signal it never emitted.
Instrument for the agent that will read the traces
Pomel's answer on where Datadog is placing bets has a detail founders should copy directly. One of them is that the company is "investing a lot so that the product can be used by agents," because that is what they see customers doing.
The other is a warning about how people are doing it today. Pointing a general-purpose coding agent at your operational issues, he says, is a bit like "send a postcard by buying a business class ticket for it." His argument is that the intelligence belongs fused into the data plane, close to the telemetry, rather than bolted on outside it as an expensive general reasoner reading through a straw.
You are not building an observability platform, so the useful translation is narrower. Assume the first reader of any given trace is a model, not a person. That changes what you write:
- Emit structured, self-describing traces. A model reading a trace should not need your tribal knowledge to know which field held the retrieved context and which held the user turn. Name things the way OpenTelemetry's conventions do, even loosely.
- Keep the trace self-contained. A trace that references an internal ticket number nobody can resolve is a dead end for an agent and for the engineer who joins next quarter.
- Pull the context to the question, not the question to the context. The postcard problem is real at your scale too. Filtering to fifty relevant traces and handing those to a model beats handing it your whole store and hoping.
The same shift is underway on the service side, where the argument is that your logs now have to say things out loud: the value of what you emit depends on how readable it is to a machine, not just to whoever is on call.
What LLM observability tools do, and when you need one
Everything above is a capture decision, which is why it comes first. The vendor choice comes second, and it is genuinely second: a tool you buy before you have decided what to record will record its defaults.
When you do go looking, the category sorts into three shapes.
- The neutral layer. OpenTelemetry's GenAI semantic conventions are not a product. They are the vocabulary, and instrumenting against them is what keeps you able to change your mind later. Start here even if you buy something.
- Purpose-built LLM tracing and eval platforms. Langfuse is open source and self-hostable, which matters if your traces contain data you would rather not ship to a third party. LangSmith is the native option if you already build on LangChain. Braintrust comes at the same data from the eval side. Arize Phoenix leans toward tracing and retrieval debugging.
- Your existing monitoring vendor's LLM product. Datadog and the other established platforms now sell an LLM observability module. The argument for it is correlation: the model trace sits next to the infrastructure and application telemetry you already collect, in a tool your team already opens.
The honest guidance for a small team is that the second and third shapes are both defensible and the choice is mostly about where your data already lives. What is not defensible is treating the purchase as the project. Every one of these tools shows you what you instrumented, and none of them shows you what you did not.
Your trace store is now your most sensitive database
Everything above told you to store the model's full input and output. That instruction creates a database nobody on your team has classified, so it is worth finishing the thought. This is our read, not the source's.
Look at what the OpenTelemetry conventions do with exactly the fields this article told you to capture. Prompt content, model output, system instructions, tool definitions, retrieved documents, and the retrieval query are all marked Opt-In rather than recommended. The warning attached to prompt content and model output is the blunt one: those attributes are likely to contain sensitive information including user and personal data. The others carry a softer note that they may contain sensitive information. The standards body treats the useful half of LLM observability as a deliberate choice with consequences. Most teams flip it on with an environment variable and never revisit it.
Four decisions worth making before you turn capture on, not after.
- Set retention before capture, not after. A trace store with full prompt content is a verbatim copy of everything your users have typed into your product, held in a third-party system, usually with a default retention nobody chose. Pick the window first. Thirty days of full content plus a longer window of metadata answers almost every real question.
- Your span builder needs its own redaction pass. If you already scrub secrets and identifiers out of your log pipeline at the emitting service, note that this is a second, separate pipeline with the same exposure, and almost nobody wires it up. Span attributes are assembled by instrumentation code that never passes through your log formatter, so a scrubber that covers your logs covers none of this.
- Treat trace access as prompt access. Your system instructions are in those spans. So is your retrieval corpus, chunk by chunk, for whoever reads enough traces. Whatever you believe about your prompts being proprietary, your access control should agree with it. In most startups, trace tooling is readable by the whole engineering org and the prompt repository is not, which is a contradiction nobody has noticed.
- Keep the traces you will need as evidence. If a prompt injection ever lands, the only thing that will tell you what the model was actually instructed to do, and what it then tried to call, is the stored input and the tool-call arguments. That is a forensic requirement, and it is a good reason to sample full content deliberately rather than capture everything and panic about the bill.
The reason to settle all four now rather than later is that every one of them is cheap as a decision and expensive as a migration. A retention window you pick before capture costs you a sentence. A retention window you pick after your first enterprise security questionnaire costs you a re-instrumentation.
There is one more reason to capture the whole tree rather than the top-level action, and it only pays off later: a complete trace is the raw material for a system that learns from its own usage. If you ever want continual learning, the sub-agent and tool-call spans you dropped for cost reasons are exactly the ones you needed.
What to do this week
- Write down the last three quality complaints you got. Not outages, complaints: the answer was wrong, the tone was off, it forgot what I said. For each, ask whether you could reconstruct what the model saw. The ones you cannot are what to instrument first.
- Capture the fully resolved prompt on one path. Pick your highest-traffic model call and store the complete input and output for it. One path, this week, before any vendor decision.
- Join cost and latency to a user action. Sum every model call triggered by one customer-visible action. Look at your worst percentile, not your average, and check that your pricing survives it.
- Add one outcome signal. A thumbs-down, a retry counter, a linked support ticket. Something that turns your traces into a filterable queue rather than an archive.
- Decide your retention window and redaction rules now. Before capture goes wide, and in writing. Include who can read the store.
- Read fifty traces by hand. Yourself, not an engineer, and not through a dashboard. The gap between what you thought your product does and what it actually says to customers is the highest-value hour available to you this quarter.
Observability at the model layer is an operating decision before it is a tooling one: what you capture, who owns it, and how fast a complaint turns into a diagnosis. That is the kind of decision the AI Operating System for Startups is built around. For how it fits alongside product, go-to-market, and the rest of the engineering picture, start with our pillar on AI for startups.
Sources
- What Top AI Labs Are Really Doing With Observability (Y Combinator), the Startup School Paris conversation with Datadog CEO Olivier Pomel that this article distills.
- Background on the company and its founders: Datadog's leadership page for Olivier Pomel and Alexis Lê-Quôc, Olivier Pomel on LinkedIn, and Datadog on Wikipedia for the 2010 founding and the company's history.
- OpenTelemetry GenAI semantic conventions, for the span attributes, the Development status, and the Opt-In classification of prompt and output content.
- Product pages for the tools named above: Langfuse, LangSmith, Braintrust, and Arize Phoenix.
Frequently asked questions
What is LLM observability?
LLM observability is the practice of recording what your model actually did in production: the fully resolved prompt and context it received, the documents it retrieved, the tools it called, what it returned, what that cost, and how long it took. It is separate from ordinary application monitoring because the failure it catches is not an error. The request succeeds, latency looks normal, nothing pages anyone, and the answer the user got is wrong. The unit of telemetry is a trace covering one user action and every model call behind it, not a log line or an exception.
How is LLM observability different from evals?
Evals score model output against a dataset you control, before you ship, and they tell you whether your system meets a standard you defined. Observability records real traffic after you ship, and it tells you what actually happened to a specific customer whose case nobody wrote a test for. Evals give you a grade; observability gives you a diagnosis. You need both, and the practical order for a small team is usually to capture traces first, because a trace you failed to record is gone forever while an eval suite can be written at any time.
What should I capture for every LLM call?
Capture four things for every LLM call, in priority order. First, the fully resolved input, meaning the system instructions, retrieved documents, conversation history, and user turn exactly as the model saw them, not the template. Second, tool calls with the arguments passed and the results returned, since agentic failures almost always trace back to an unexpected tool result. Third, cost and latency joined to one customer-visible action rather than to an endpoint. Fourth, one thin outcome signal such as a thumbs-down or a linked support ticket, so you can filter traces to the cases where the user was unhappy.
Is it safe to store prompts and model outputs in traces?
Storing prompts and model outputs in traces is safe only if you treat the trace store as sensitive data, because a full-fidelity trace store is a verbatim copy of everything users typed into your product plus your own system instructions and retrieval corpus. The OpenTelemetry GenAI semantic conventions make this explicit: prompt content, model output, system instructions, and retrieved documents are all classified Opt-In, and the spec warns that prompt content and model output are likely to contain sensitive information including personal data. Decide a retention window before you turn capture on, redact in your own instrumentation layer rather than in a vendor console, and remember that read access to traces is effectively read access to your prompts.
Build your AI Operating System
A practical course to grow with AI, build internal tools, and operate safely. Join the waitlist and you'll be first in when the course opens.